MM014 – Snowflake vs Star Schema: And the winner is…
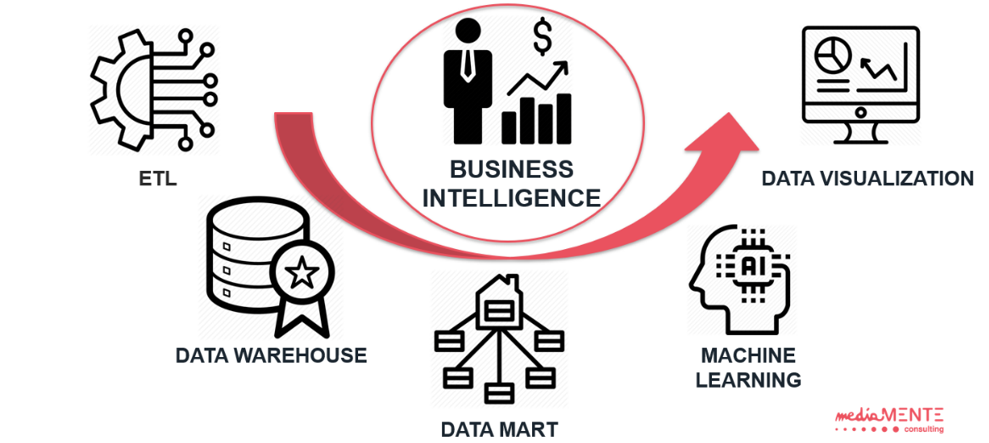
When we talk about BI “Business Intelligence”, we refer to a set of processes and objects (e.g. tables) for collecting and analyzing information, with the goal to support business decisions. Thanks to the ETL (“Extraction, Transformation & Loading) layer, we can provide a complete data integration between multiple external sources (ERPs, files, web, etc.). They gather in a DWH “Data Warehouse”, a consolidated and stable storage system.
Then, to reflect and support at best different analysis requests by different business teams into the company, data are logically or physically organized in the so-called “Data Marts”.
Dimensions-Fact Model
The front-end side of a DWH is based on the concept of multidimensional model or DFM (Dimensional Fact Model), a conceptual model to represent data within a Hypercube, where each edge represent a “Dimension” of analysis. The hypercube will be subsequently divided into many “cubes”, each one of them identified by a triple of coordinates: The values assumed by the measures for that data triad is commonly referred to as “Fact”.
So, in general, a multidimensional model is mainly based on four key concepts:
- Fact: Table that typically models a specific business area (Sales, Orders, Production, etc.) and is characterized by a lot of useful measure for the firm management. It represents the occurrence of an event concerning the specific business domain;
- Measurement: It is the quantitative aspect of the fact and it is of high importance for the analysis. From this measures are extracted the KPIs “Key Performance Indicator” that will guide enterprises in their business strategies. Some examples can be the quantity produced, the profit, and price;
- Dimension: It represents the coordinates of the analysis, e.g. Date, Product, Shop;
- Dimensional Attribute: It is a logical grouping of some elements of a same size. They are classes of elements that allow the user to select the data based on specific characteristics.
DB Performance or DB Management?
Now that we have set the schemas in a visual context, we are ready to see how a single fact table is linked to several dimension. The two main types of presentation area are the so-called “Snowflake” and “Star” schemas.
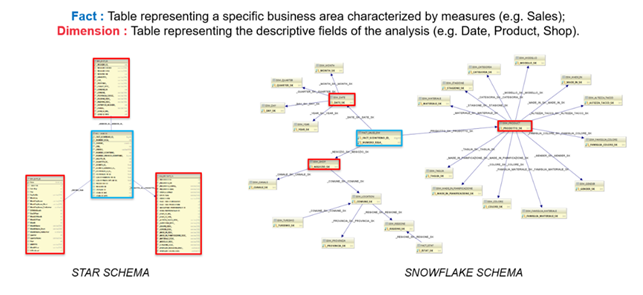
In this picture, on the left, we can see the Star Schema, composed by few tables but full-bodied. The structure is very simple and easy to understand because is implemented to get the support decision strategies for managers easy. Another important feature of the model are the high performing queries, because if several attributes are merged in one table, there is an incredible reduction of joins needed. Otherwise, the loading time of the data is a little bit long, because the data redundancy due to the de-normalization causes an increase in size of the table, but in this way is able to be widely supported by a large number of business intelligence tools.
On the right, we have the Snowflake Schema. This type of model is implemented with the goal to have a DWH with the best performance as possible. Of course, it is characterized by a complex architecture with several thin but specialized tables to avoid large code changes and eliminate the redundancy. It is also important the use of surrogate keys (which often are integer type, to speed up the process if compared to the correlation time e.g. of char datatype). They improve efficiency in data loading time but, on the other side, reduce queries performance due to the need of several joins from the tables.
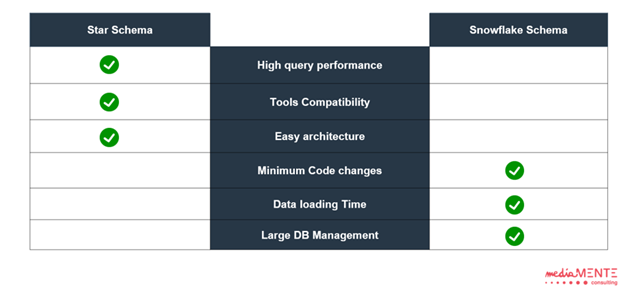
And the winner is…
We can sum up that the Star schema has better performances if a client needs a data warehouse with high query performance, tools compatibility and an easy architecture of the schema, while Snowflake is the best type of implementation if we need a minimum data loading time, and a high DB management with minimum code changes.