MM010 – What-If Analysis: An Example with Sandboxes
Simulation models are used to facilitate decision making and understand how a system works in the current scenario (properties, features, and limitations), as well as whether specific conditions occur. Analyzing decisional alternatives, and the effects of correlations between variables of a model, it is useful to develop plans and strategies, evaluating their costs, time and risks.

In the market, different software with advanced what-if analysis and scenario simulation capabilities are available. In the business case illustrated below, it has been used IBM Planning Analytics and its web-based user interface PAW, which supports multidimensional self-service analytics, what-if scenario modeling, and data manipulation.
An electronic component manufacturing firm, to quickly enter emerging markets, is planning to allocate three of its existing plants to the production of new products. This will require a new layout and production line. At the same time, considering the steady growth of the established market and forecasted demand, the management has set a challenging production goal for the next year.
We helped production managers and the Chief Operating Officer setting the following interactive dashboards for scenario simulation. On the top side are shown relevant information, such as reconverted plants and expected goal. The slide selectors on the right allow users to choose an individual Plant, synchronizing and updating accordingly the table and chart below.
The first table (Budget Quantity – Base vs Rif) shows, for each product family, the actual number of units produced in 2019 (Quantity Rif) and those planned to achieve the business goal, within plant availability and capacity boundaries (Quantity).
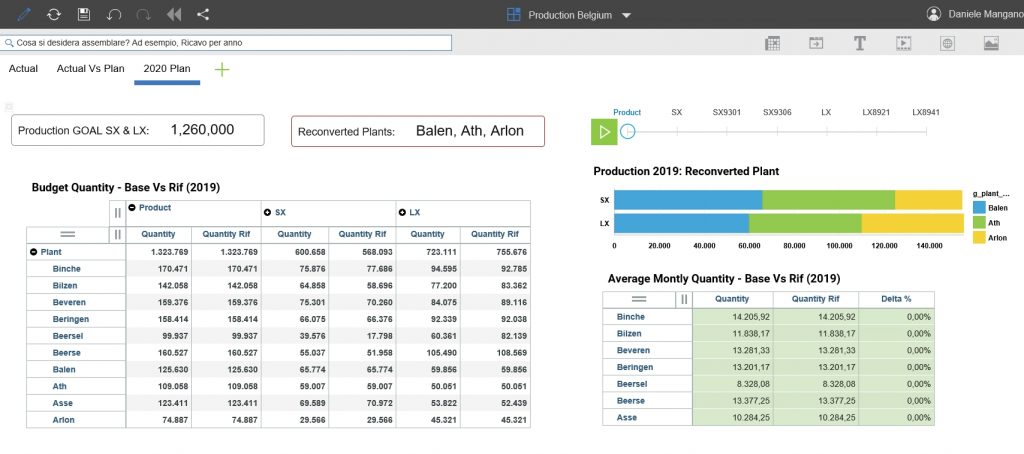
Using actual production of 2019 as the starting base, the planned quantity has been calculated through the following steps:
- the quantity of reconverted plans (Balen, Ath, Arlon) was set to zero;
- Beersel and Asse value was set to maximum production capacity;
- the quantity of the plants Binche, Beveren and Beerse, which have a greater potential capacity than the others, was increased respectively to 198500, 182900 and 185500 to partially counterbalance the decrease in production of the reconverted plants. The total units produced at this point were about 1,09 M (table above);
- the goal value of 1,26 M was allocated proportionally, based on the current value, on each plant except for those mentioned in point 2), already exploited to the maximum. This functionality is called Hold and Spread. Several ways of spreading data can be used (relative proportional, equal, percent change, straight line, etc.).
Increasing production by 25% or more could jeopardize efficiency and product quality. An increase of 35% is also not feasible, also for plants with greater potential capacity, due to high investment and resources required. A simulation of possible alternatives can therefore be useful to facilitate decision making.
The production plan obtained as described above is used as benchmark for scenario analysis. This analysis exploits Sandboxes, but it could ultimately be performed in a different way, such as creating new elements in the scenario dimension or ad hoc structure and processes.
In the table Quantity – Scenario Comparison below, three scenarios are created through Sandboxes:
- Worst Case Scenario;
- Most Likely Case Scenario;
- Best Case Scenario.
Each scenario, initially coincident with 2019 actual production (Quantity Rif), is a separate layer of data and could be adjusted through manual data entry and Hold/Spread functionality.
The Percentage Delta compares in percentages point the actual number of units produced (Rif), with those planned in the Sandbox. The conditional formatting highlights riskier plants based on their Delta value.
The comparison charts give a quick graphical insight into the analysis.
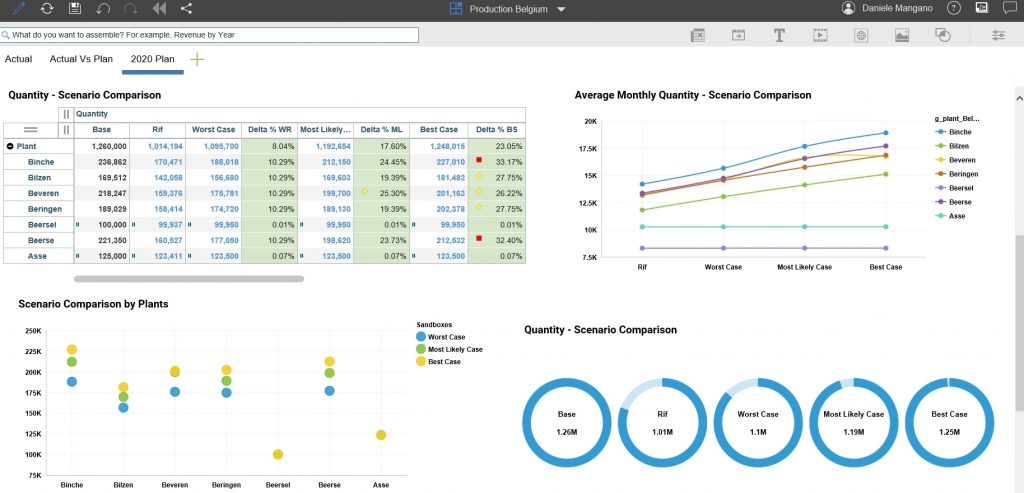
The simulation leads to the conclusion that the production goal of 1,26 M is not achievable. In the Best-case scenario, to reach a production of 1,248 M, five plants should increase their actual production by more than 25% and two of them by more than 30%. The improvement needed is beyond realistic expectations and would require overbudget investment, resources and time.
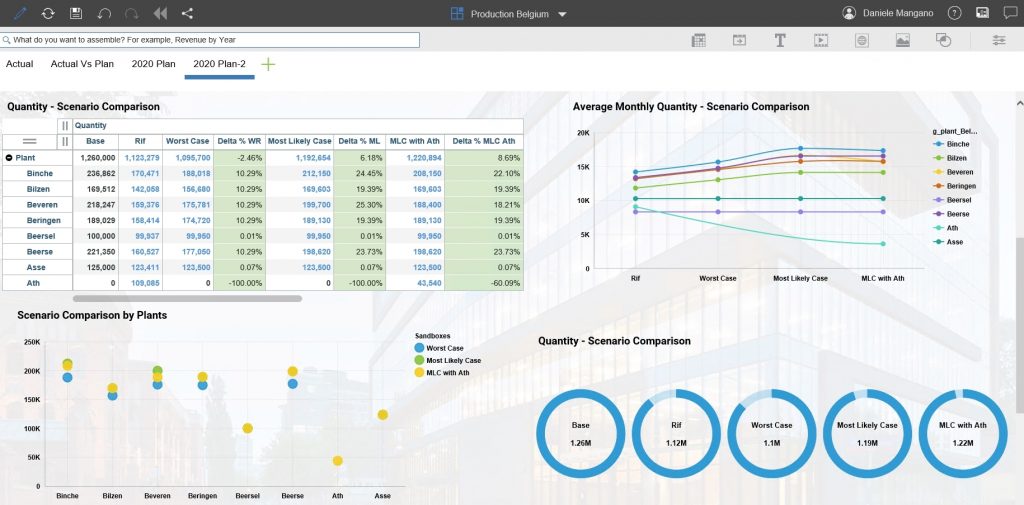
With additional analysis, production managers have chosen to consider another possible scenario: convert only half of Ath plant and postponing the total conversion of six months. This solution, called MLC with Ath in the figure below, could generate inefficiencies, but overall would allow to reduce risks and costs.
Want more? Contact us!
Header image from Entrepreneurship Vectors by Vecteezy.